Native Performance Profiler
The performance profiler is a tool for performance analysis and statistics that is currently only available on native platforms.
Default statistics
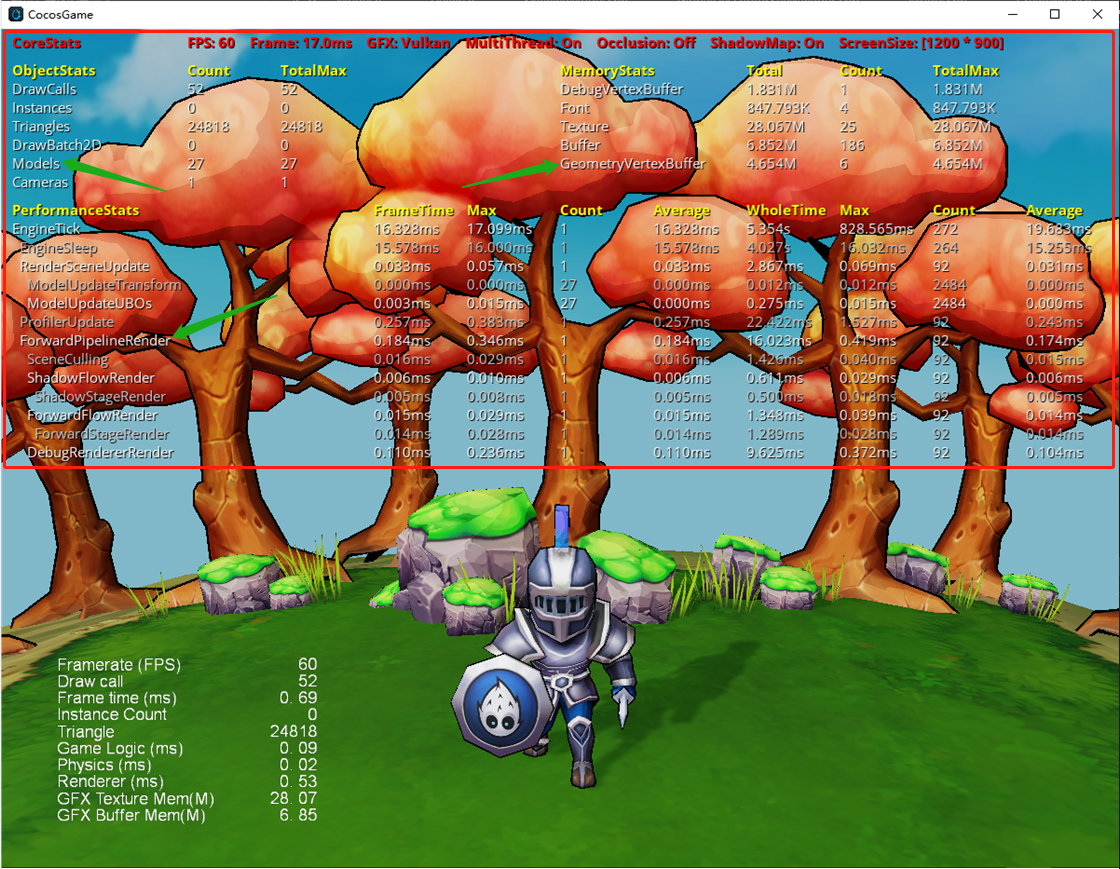
The performance profiler is shown as follows:
Different from the old version of
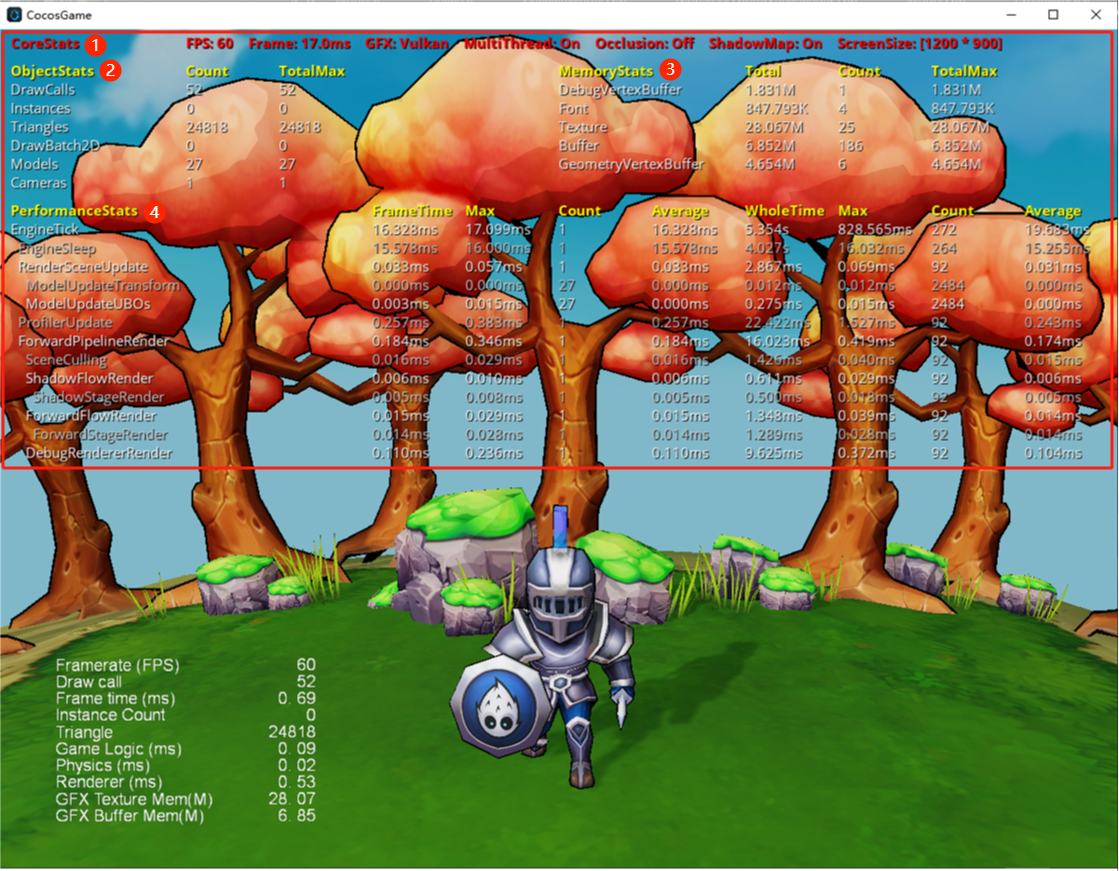
Profilerin the lower left corner, the new version ofProfilerprovides more detailed game performance and memory statistics, and supports expansion. Developers can freely add performance and memory data that they care about. The default data is as follows:Core statistics
CoreStats, including:- frame rate
- render time per frame
- GFX backend
- Whether to enable multithreading
- Whether to enable occlusion query
- Whether to enable shadow maps
- Screen Resolution
Object count statistics
ObjectStats, including:- number of render calls
- Number of instantiations
- Number of triangles
- Number of 2D rendering batches
- Number of rendered models
- Number of cameras
Memory usage statistics
MemoryStats, including:- Vertex buffer size for DebugRenderer
- Native font memory size
- Video memory occupied by textures
- The video memory occupied by Buffer
- GeometryRenderer vertex buffer size
Performance Statistics
PerformanceStats, showing the logical thread call stack, contains for each profiled code segment:- total execution time per frame
- Maximum time for a single execution per frame
- total number of executions per frame
- average execution time per frame
- Total historical execution time
- The maximum time of a single execution in history
- Total number of historical executions
- The average time of a single execution in history
How to use
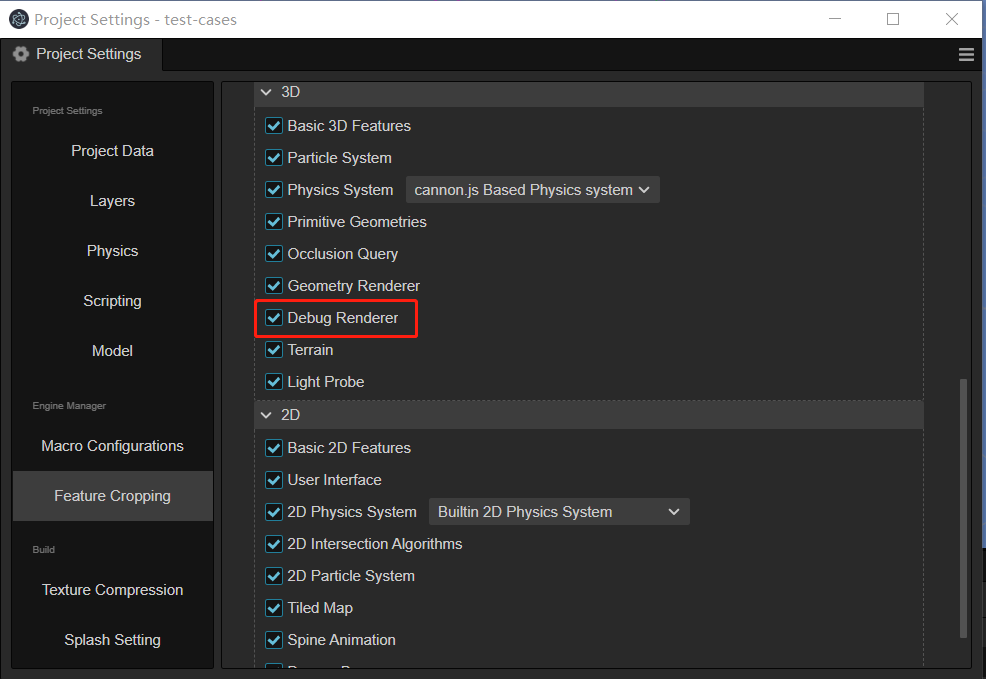
In the main menu of the editor: Project -> Project Settings -> Feature cropping, check Debug Renderer, this option is closed by default, you need to open it to display the debug information:
Change the macro definition of
CC_USE_PROFILERto1innative/cocos/base/Config.h, and then change it back to0after the performance and memory optimization is completed. At this time, the performance profiler is completely closed and will not Cause any side effects on the code:#ifndef CC_USE_PROFILER #define CC_USE_PROFILER 0 #endifIf you want to add the statistical information of
ObjectStats, such as counting the number of rendered models per frame (need to be called in a function such as update for each frame):The following macros are defined in native/cocos/profiler/Profiler.h. Developers can use it as needed.
void RenderScene::update(uint32_t stamp) { ... CC_PROFILE_OBJECT_UPDATE(Models, _models.size()); }CC_PROFILE_OBJECT_UPDATEfor updating statisticsCC_PROFILE_OBJECT_INCfor incrementing statisticsCC_PROFILE_OBJECT_DECfor decrementing statistics
If you want to add
MemoryStatsstatistics, such as counting the memory usage ofGeometryRenderervertex buffer:void GeometryVertexBuffer::init(gfx::Device *device, uint32_t maxVertices, const gfx::AttributeList &attributes) { ... CC_PROFILE_MEMORY_INC(GeometryVertexBuffer, static_cast<uint32_t>(_maxVertices * sizeof(T))); }CC_PROFILE_MEMORY_UPDATEfor updating memory usage (bytes)CC_PROFILE_MEMORY_INCfor incrementing memory usage (bytes)CC_PROFILE_MEMORY_DECfor decrementing memory usage (bytes)
If you want to add
PerformanceStatsstatistics, such as the execution time (in milliseconds) of theForwardPipeline::renderfunction:void ForwardPipeline::render(const ccstd::vector<scene::Camera *> &cameras) { CC_PROFILE(ForwardPipelineRender); ... }After the above modification, compile and run, you can see the new statistics on the screen: