Cocos Creator
Debugging JavaScript on Native Platforms
After a game is released on the native platform, because the runtime environment is different, there may be some bugs that cannot be reproduced in the browser preview. This means it is necessary to debug it directly on the native platform. Cocos Creator makes it easy to debug JavaScript remotely in the native platforms.
Debugging on Android / iOS
If a game can only run on a physical device, then the packaged game must be debugged on a physical device. Debugging steps are as follows:
Make sure that the Android / iOS device is on the same LAN as Windows or Mac.
Select the Android/iOS platform and Debug mode in the Build panel to build, compile and run a project (for the iOS platform, it is recommended to connect to the physical device via Xcode to compile and run).
Open this address with Chrome browser:
devtools://devtools/bundled/js_app.html?v8only=true&ws=Local IP of the device:43086/00010002-0003-4004-8005-000600070008.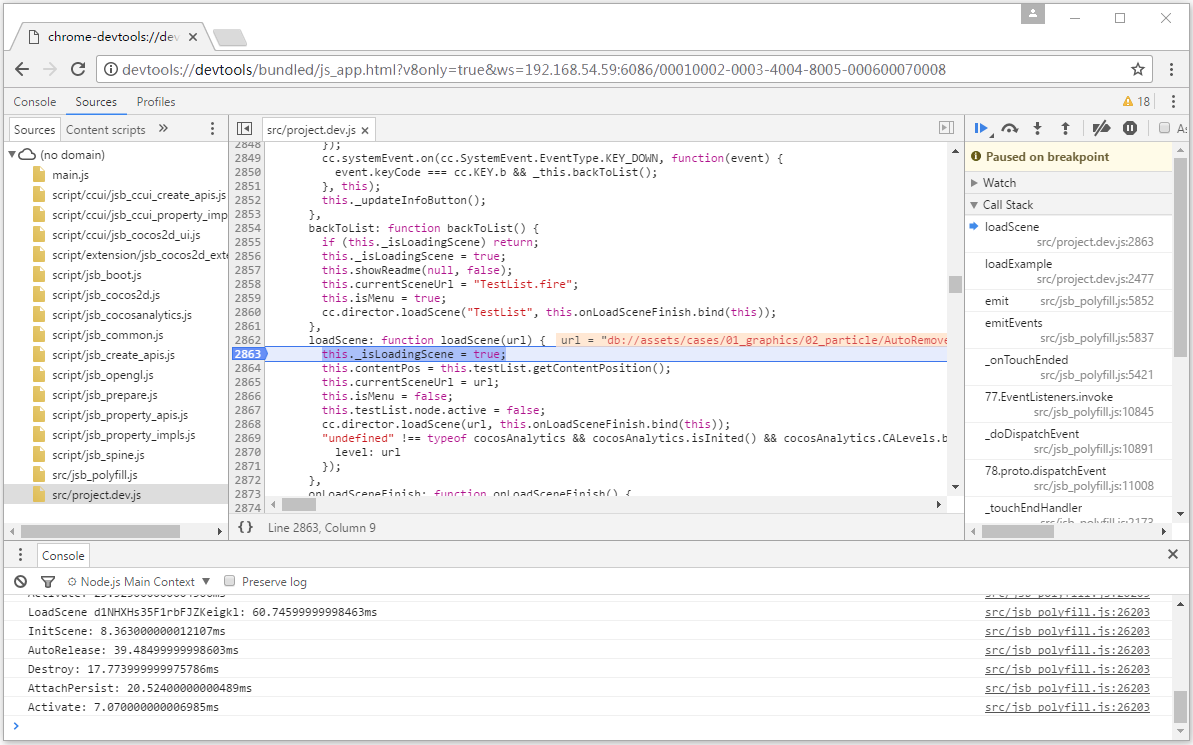
If the port is occupied, the port will auto-increment by +1. If you cannot connect, please check the port number printed in the console when the App starts. It is recommended to check the "Debug" and "Source Maps" options when buiding. This ensures that the corresponding JavaScript code is displayed in an expanded format.
Debugging on Windows / Mac
The steps for debugging a game on the Windows / Mac platform are similar to the Android / iOS, just compile the project and run it in the IDE.
- Compile and run the packaged project with the IDE (Visual Studio for Windows and Xcode for Mac).
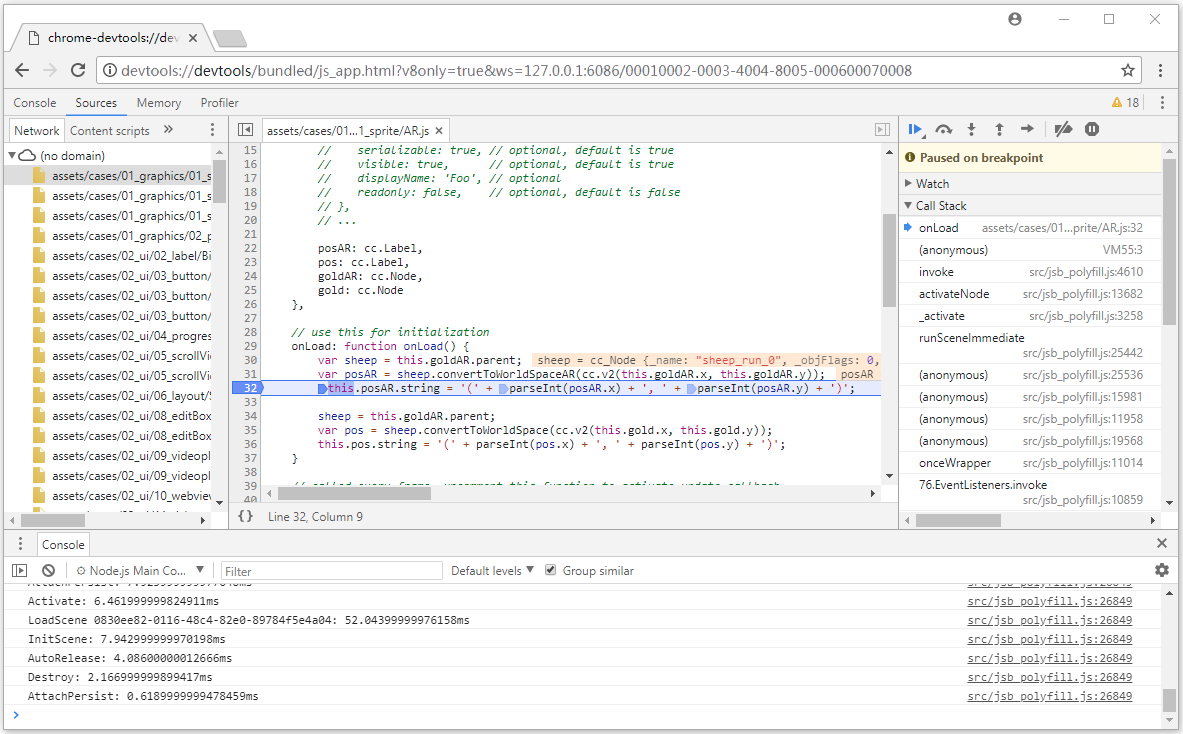
- Open Chrome while the game is running and enter the address:
devtools://devtools/bundled/js_app.html?v8only=true&ws=127.0.0.1:6086/00010002-0003-4004-8005-000600070008to debug it.
Using lldb to view the current JS call stack
By using breakpoints in C++, we can easily see the C++ call stack, but not the JS call stack at the same time, which often breaks the debugging experience. The features provided by lldb allow doing a lot of things during debugging, including viewing the call stack.
Both Xcode and Android Studio use lldb as debugger by default. For more details, please refer to the LLDB Guide documentation.
Global configuration of lldb
lldb will load ~/.lldbinit at startup, for example the following configuration:
~ % cat ~/.lldbinit
target stop-hook add
po se::ScriptEngine::getInstance()->getCurrentStackTrace()
DONE
The behavior after setting every breakpoint and executing the following code to output the JS call stack:
txt
po se::ScriptEngine::getInstance()->getCurrentStackTrace()For more information on the usage of target stop-hook, please refer to the Examining Variables documentation.
However, this approach has an obvious drawback: it works for all projects and will result in an error if the corresponding symbol does not exist for other projects.
Configuring lldb in Xcode
Editing Action in breakpoints in Xcode (only triggered for specific breakpoints)
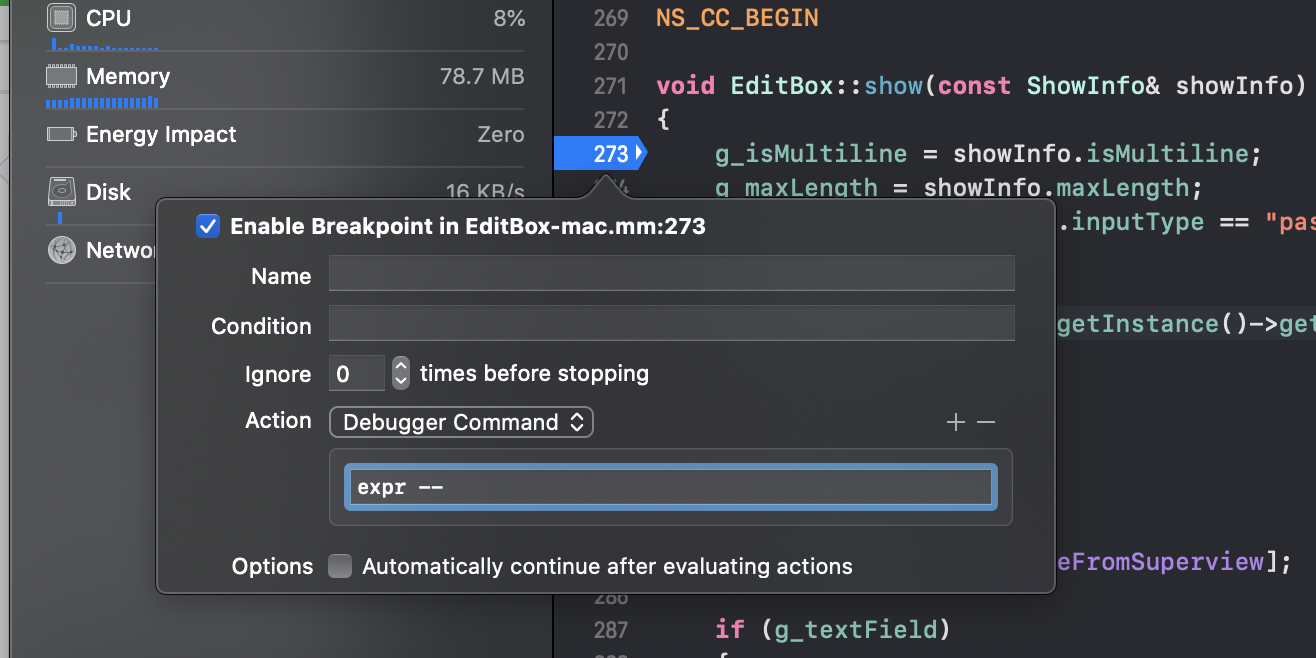
Enter the following command in the Debugger Command:
txt
po se::ScriptEngine::getInstance()->getCurrentStackTrace()For more information about the usage of target stop-hook, please refer to the Evaluating Expressions documentation.
Setting stop hook
After the breakpoint is triggered, a callback needs to be added to the lldb console. More calls can be made for specific breakpoints: the
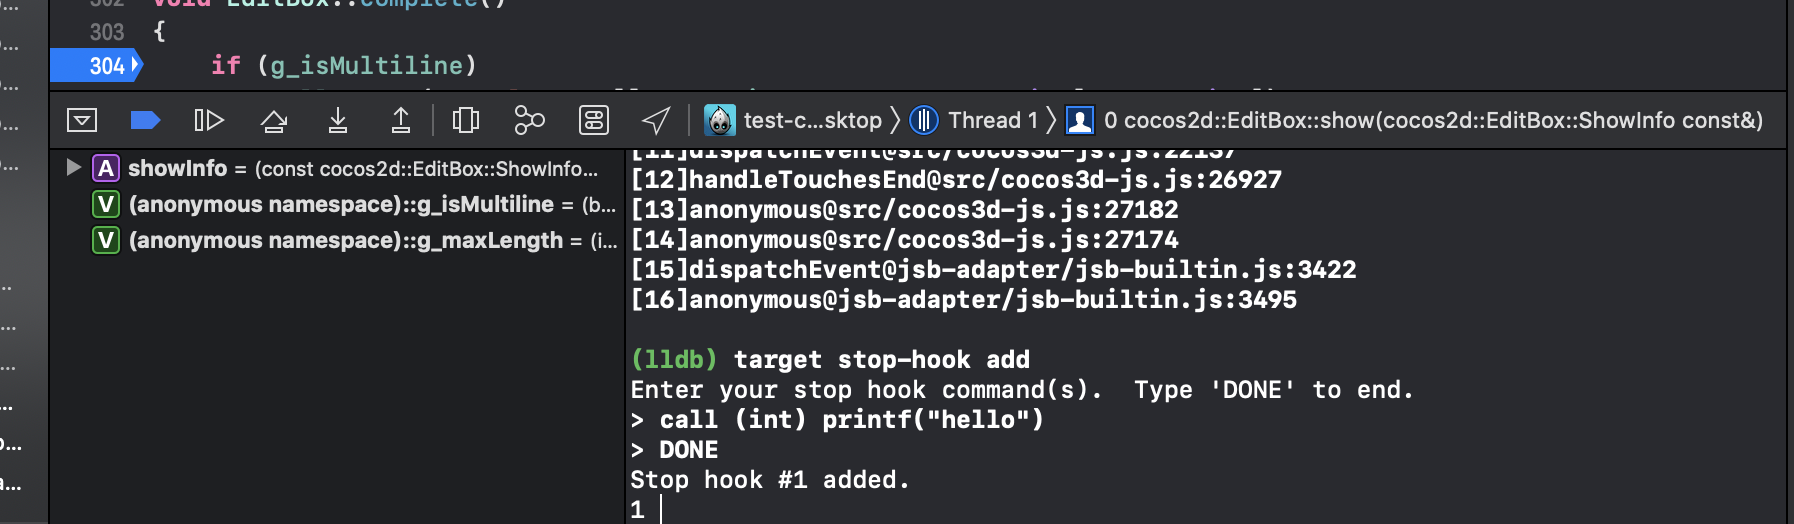
As above, the call stack can also be viewed by executing the following code:
txt
po se::ScriptEngine::getInstance()->getCurrentStackTrace()Configuring lldb in Android Studio
Configure in the Run -> Debug Configuration -> Debugger interface of Android Studio:
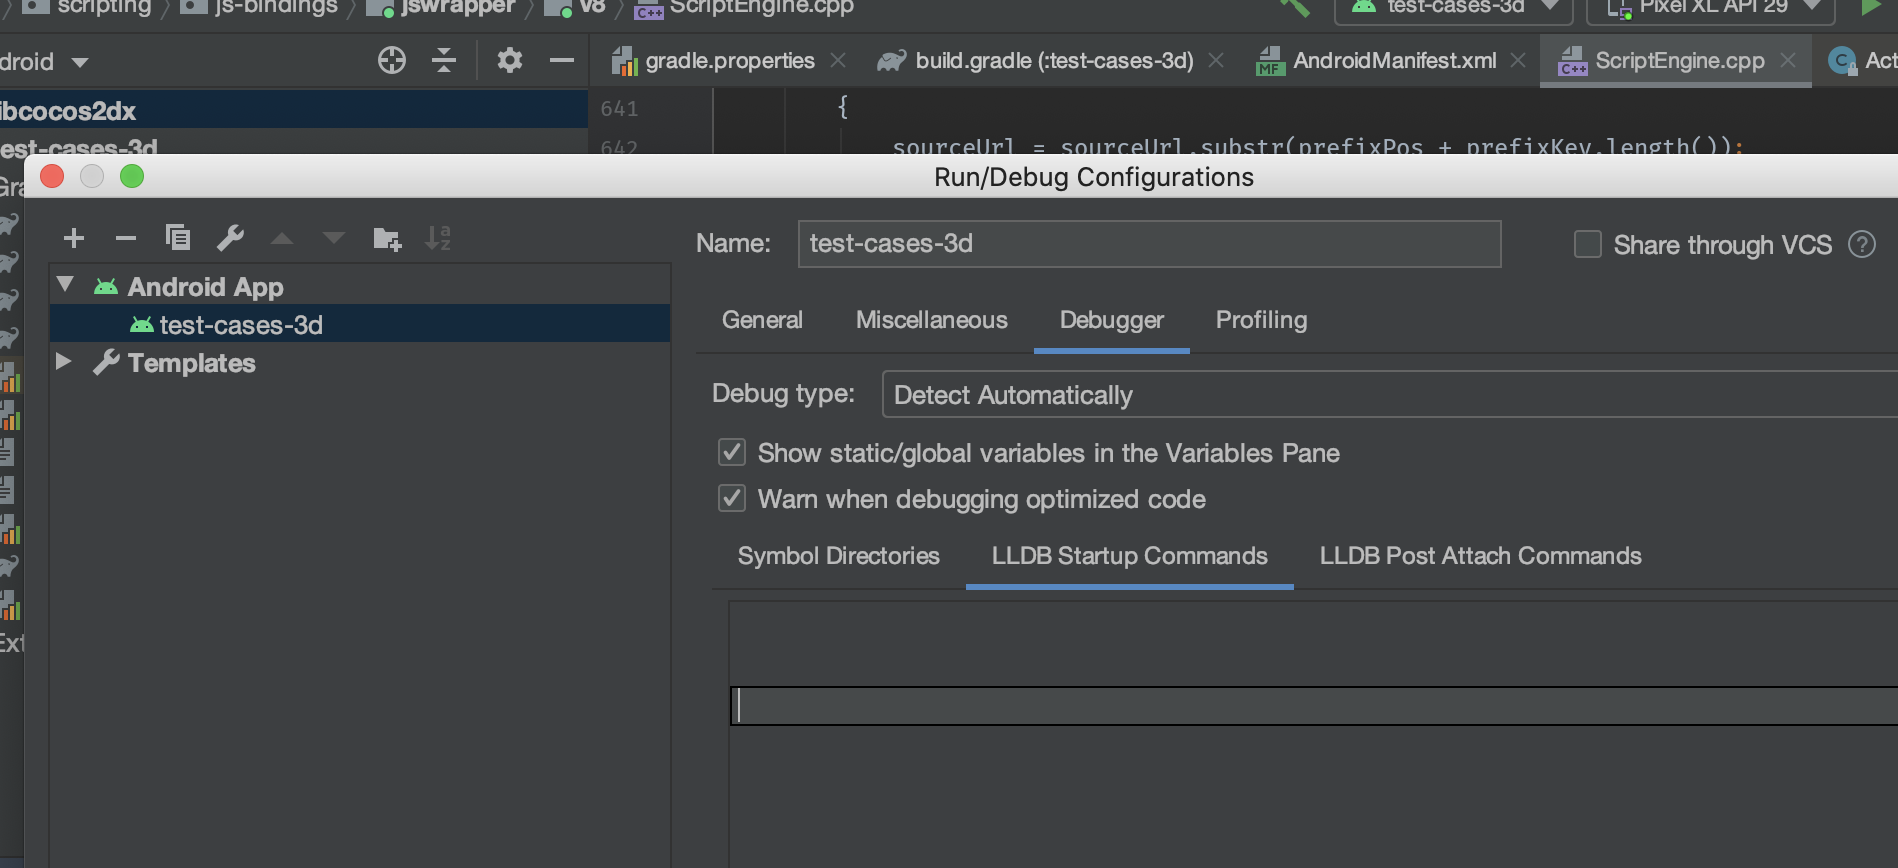
Android Studio also provides a lldb console similar to Xcode.
Advanced Debugging Guide
To debug in Release mode, or need to debug a customized native engine, please refer to the more detailed JSB 2.0 Usage Guide: Remote Debugging and Profile documentation.